.png)
HYROX Chicago vs London. Two Fast Courses for Very Different Reasons. Plus, HYROX Retention Growth and a Bounty Winner Turned Partner.
Welcome to The Extra Lap! Each week, we’ll be sharing HYROX insights and analysis, product updates, stories, community shoutouts and much more.
Stat of the Week
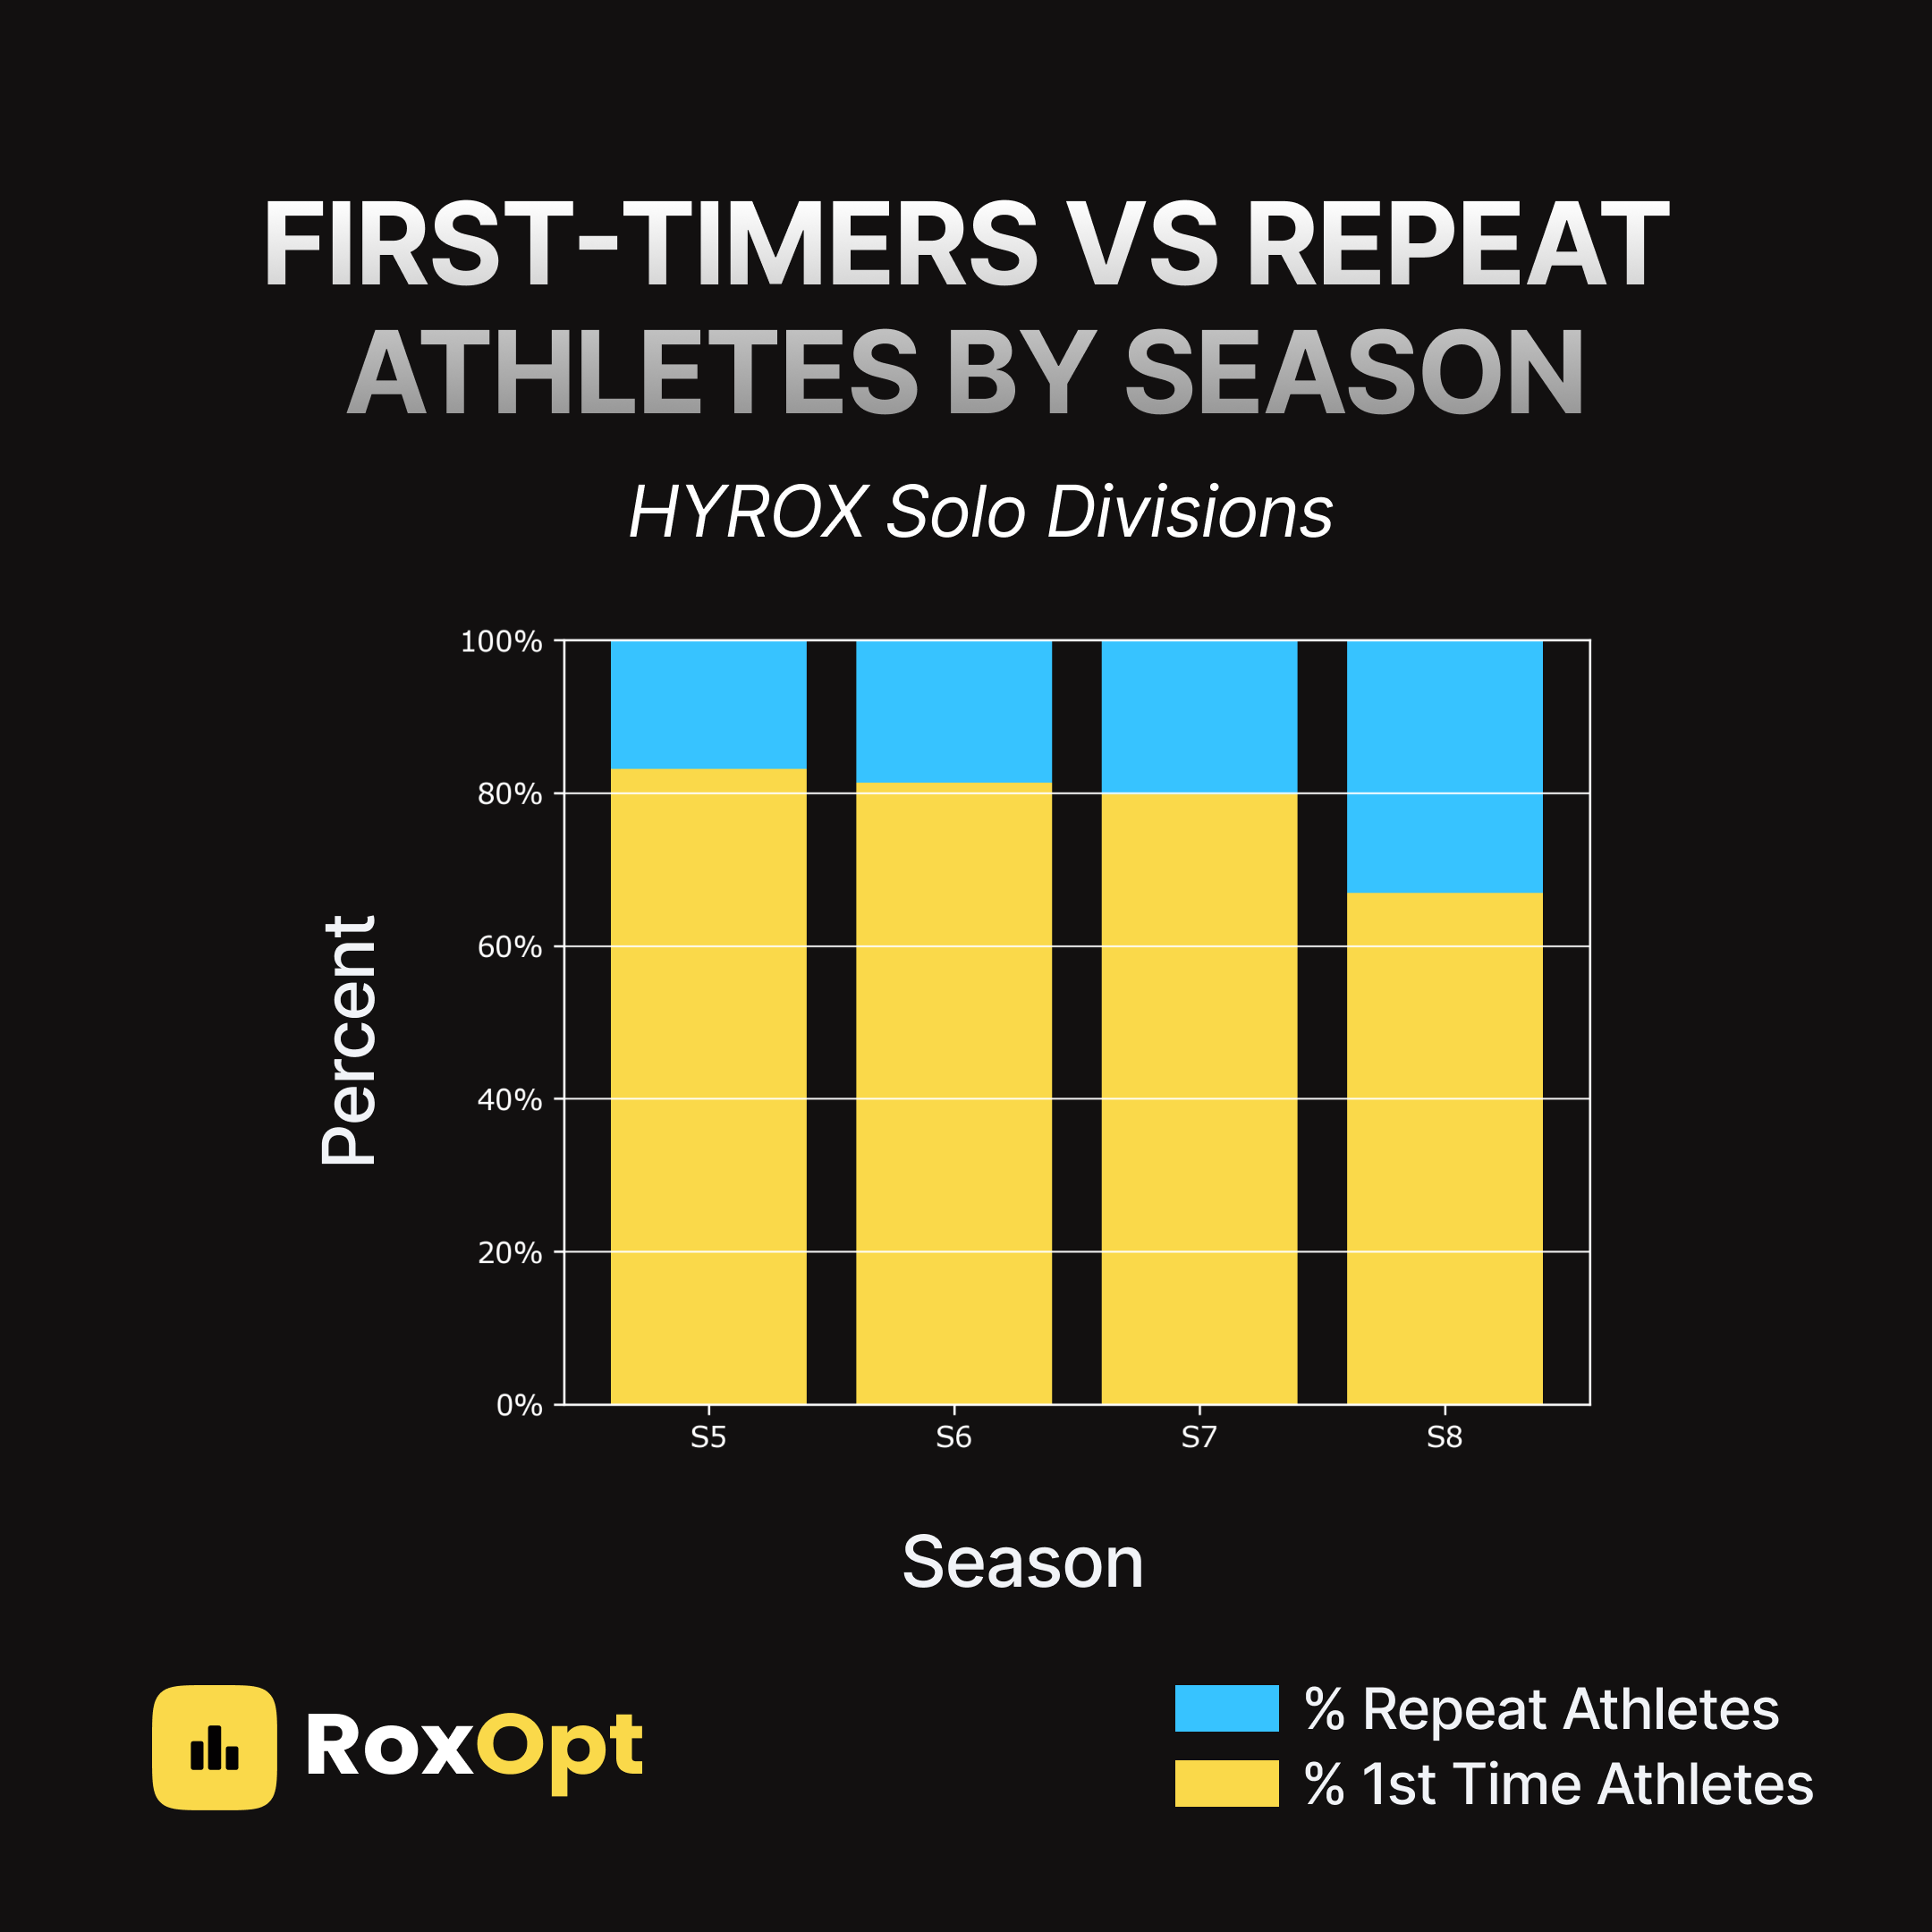
This season, 33% of HYROX solo athletes are repeat competitors, having raced in previous seasons. That’s a meaningful jump from prior years, which consistently sat in the 16–20% range.
This is a strong signal for the long-term sustainability of the sport. New athlete quantity is growing rapidly, but importantly, HYROX is improving athlete retention at the same time.
Take a look at the % mix of first-time vs. repeat athletes over the past four seasons for the solo divisions.
A Small World
Last month, RoxOpt customer Neil Ribelli took down the $100 Bounty at HYROX Chicago, beating his open-to-pro peak potential with an impressive 1:05:35.
While coordinating payment, I noticed he lived in Cleveland, OH, a city that has a special place in my heart having lived there for 14 years before moving to Boston 3 years ago.
Turns out Neil also lives in the exact same neighborhood where I had lived!
Additionally, I just happened to be heading to Cleveland the following week for Thanksgiving with my family.
So of course, we HAD to throw down.
On Black Friday, we had a gym all to ourselves, ripping ergs and moving sleds. It was awesome.
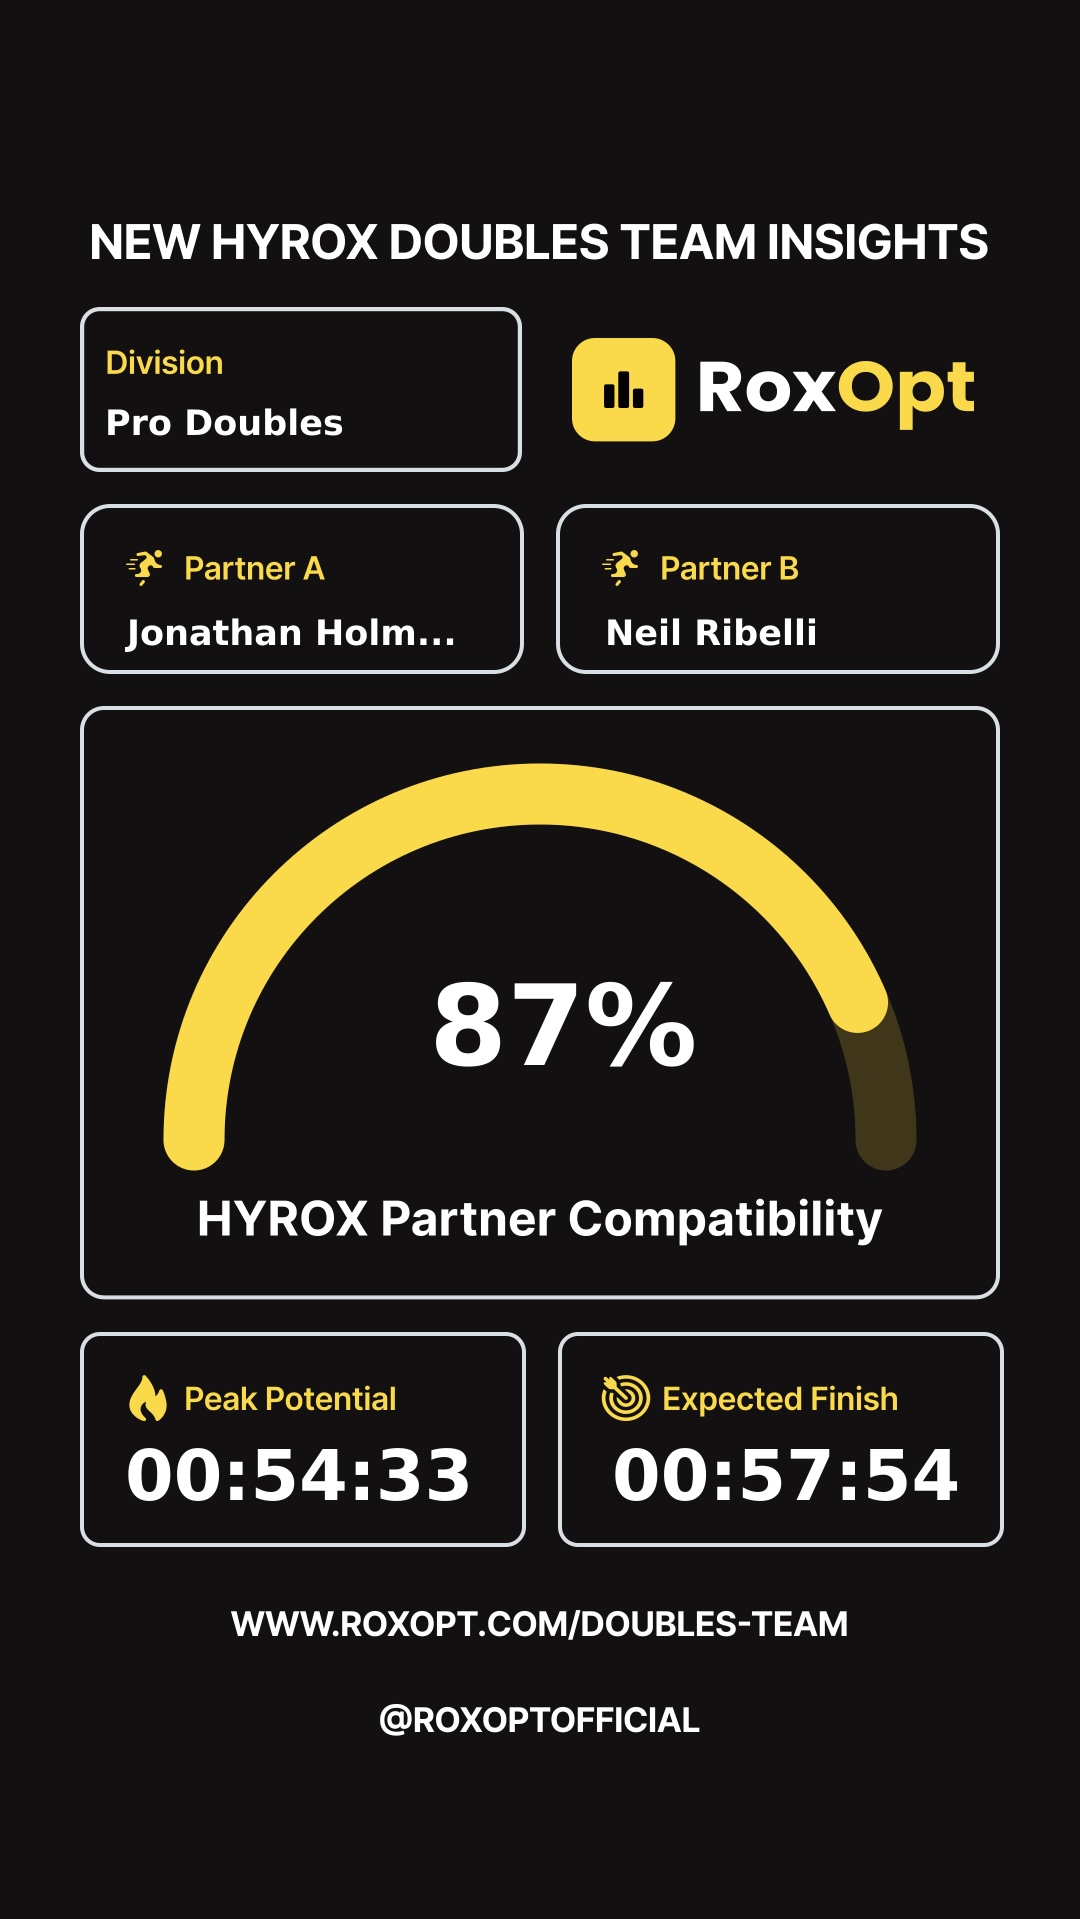
Naturally, I put our names into the RoxOpt New Doubles Team Predictor
Partner Compatibility: 87%
Expected: 0:57:54
Predicted Peak: 0:54:33
We are now signed up for Miami Pro Doubles.
Hopefully, Neil can help me break my own model and punch a world’s ticket.
A Tale of Two Fast Courses
The moment people saw the London course map, the fast course expectation was set.
All weekend, I received DMs asking for our course speed analysis.
I just assumed it would pop as an outlier like Berlin and New York. However, come Monday, I was shocked at the results.
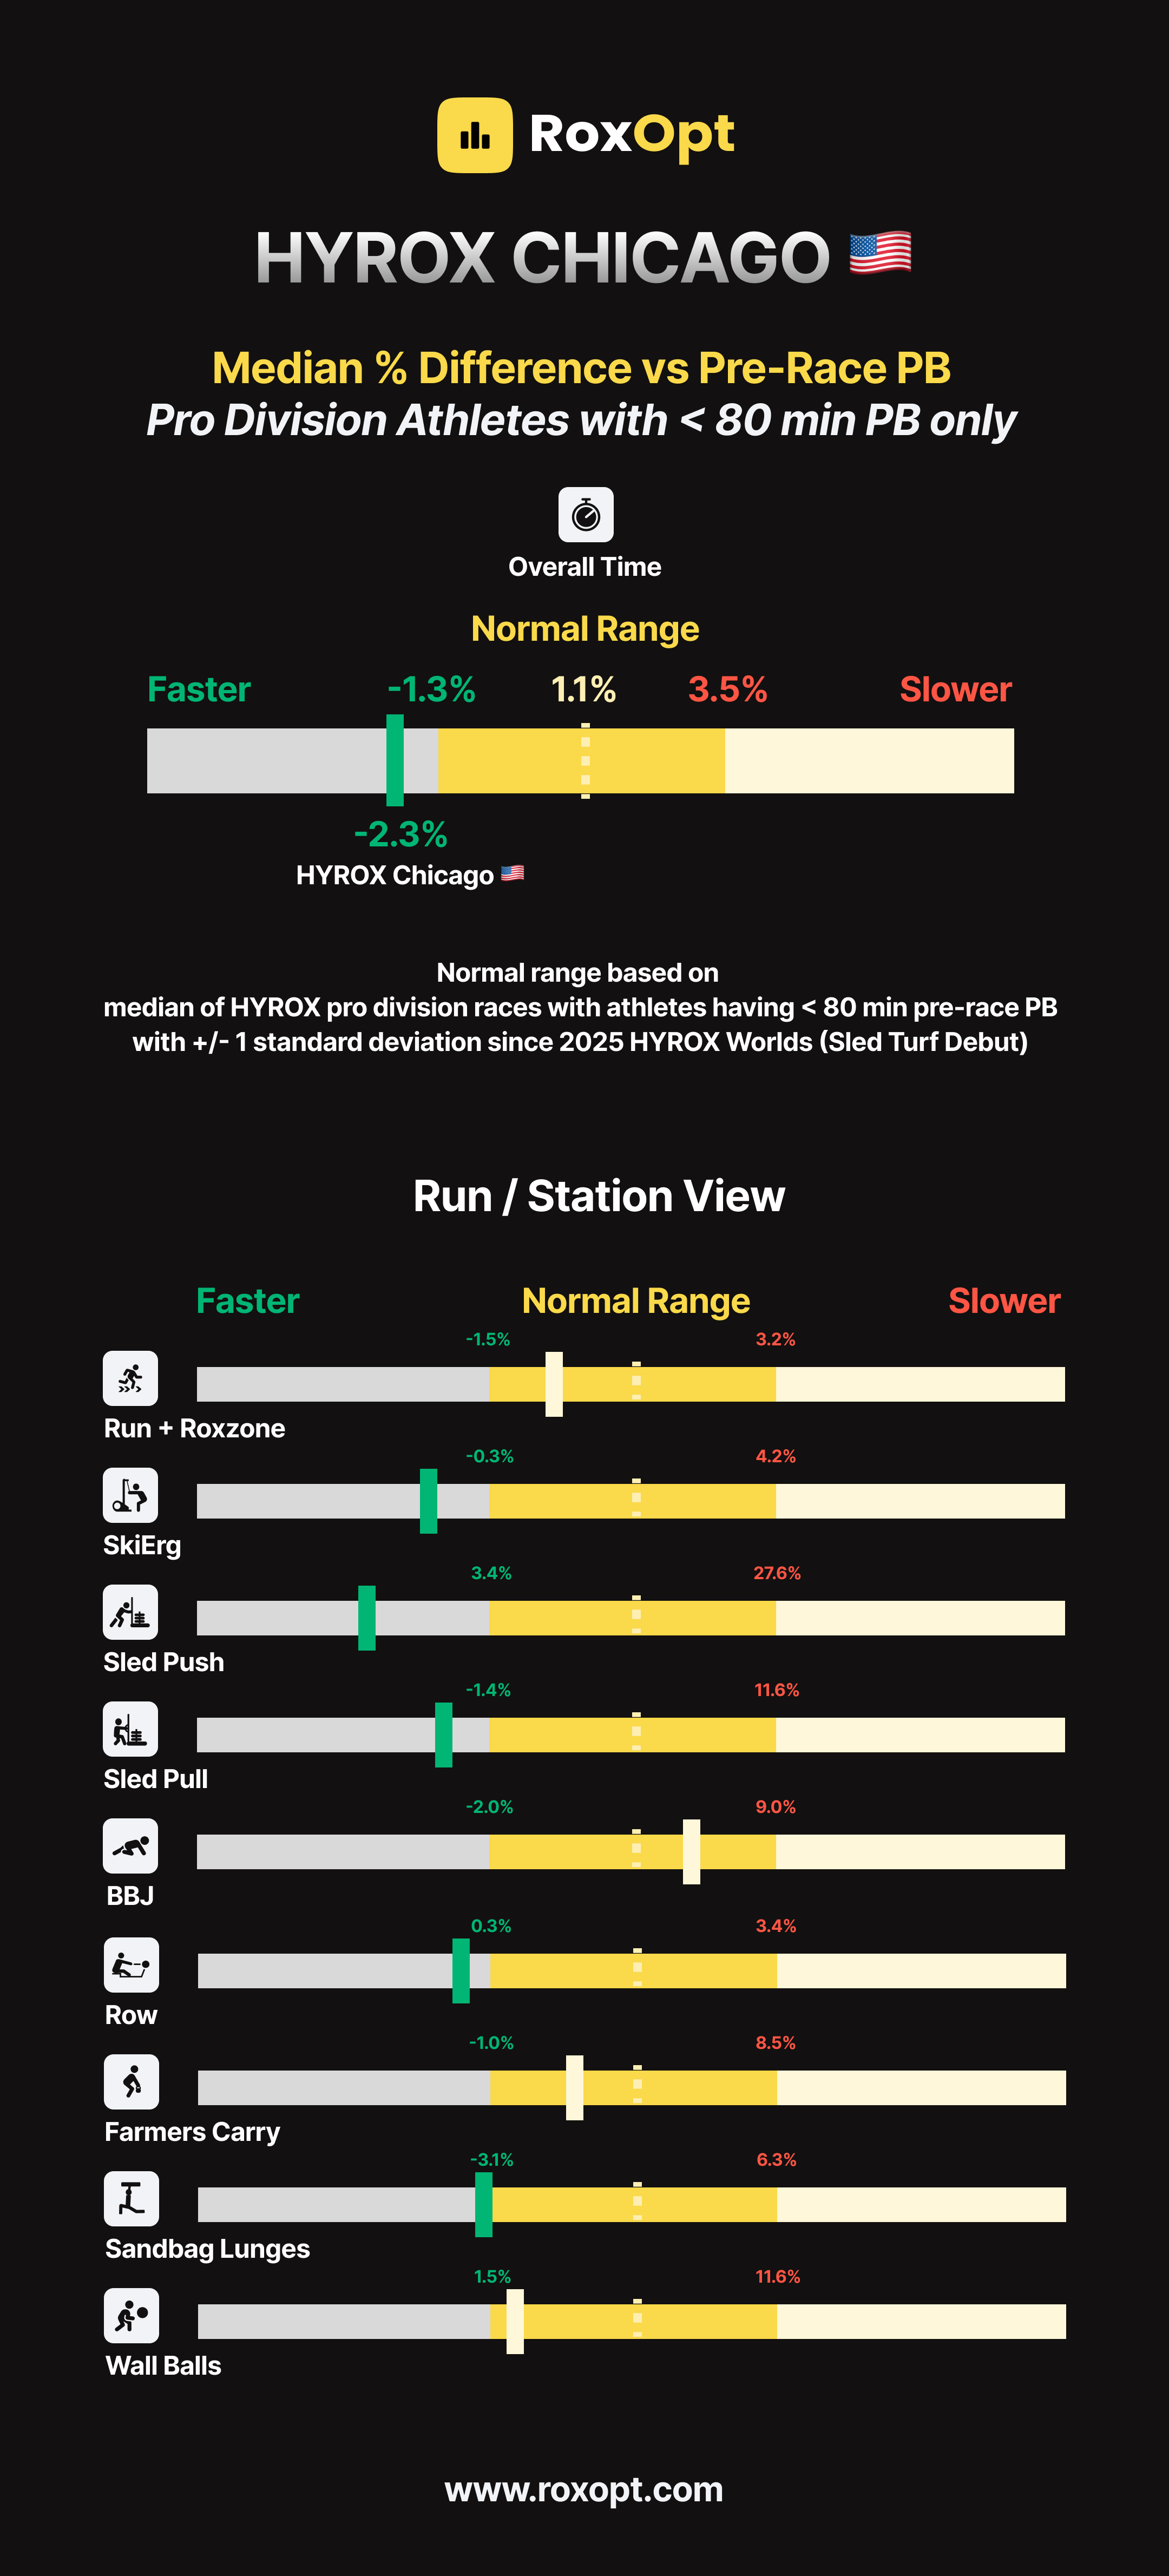
Not that it wasn’t fast… it was fast, but that Chicago was faster.
London was talked about as an unfair course on an island by itself.
There wasn’t much debate on Chicago that I could see online after that race.
However, I will admit having raced there and achieved my own PB, the conditions were amazing.
I spent 3 days searching for metrics to show London as faster than Chicago and I just couldn’t find any evidence that clearly separated the courses and scaled across all HYROX venues.
Admittedly, I was motivated by my own personal bias with a Chicago PB and knowing there would be backlash if we didn’t say London was unmatched by any other course to fit the narrative.
Often people point to data points to show why a course was fast or slow but rarely do they check those same data points for every other race. It’s tedious but essential.
That’s how you know if a race is a true outlier.
People also will cherry pick high level pro division athletes with out-sized PBs… but ignore other similar athletes who didn’t PB on the same course… or ignore other HYROX courses that had similar athletes with similar PBs.
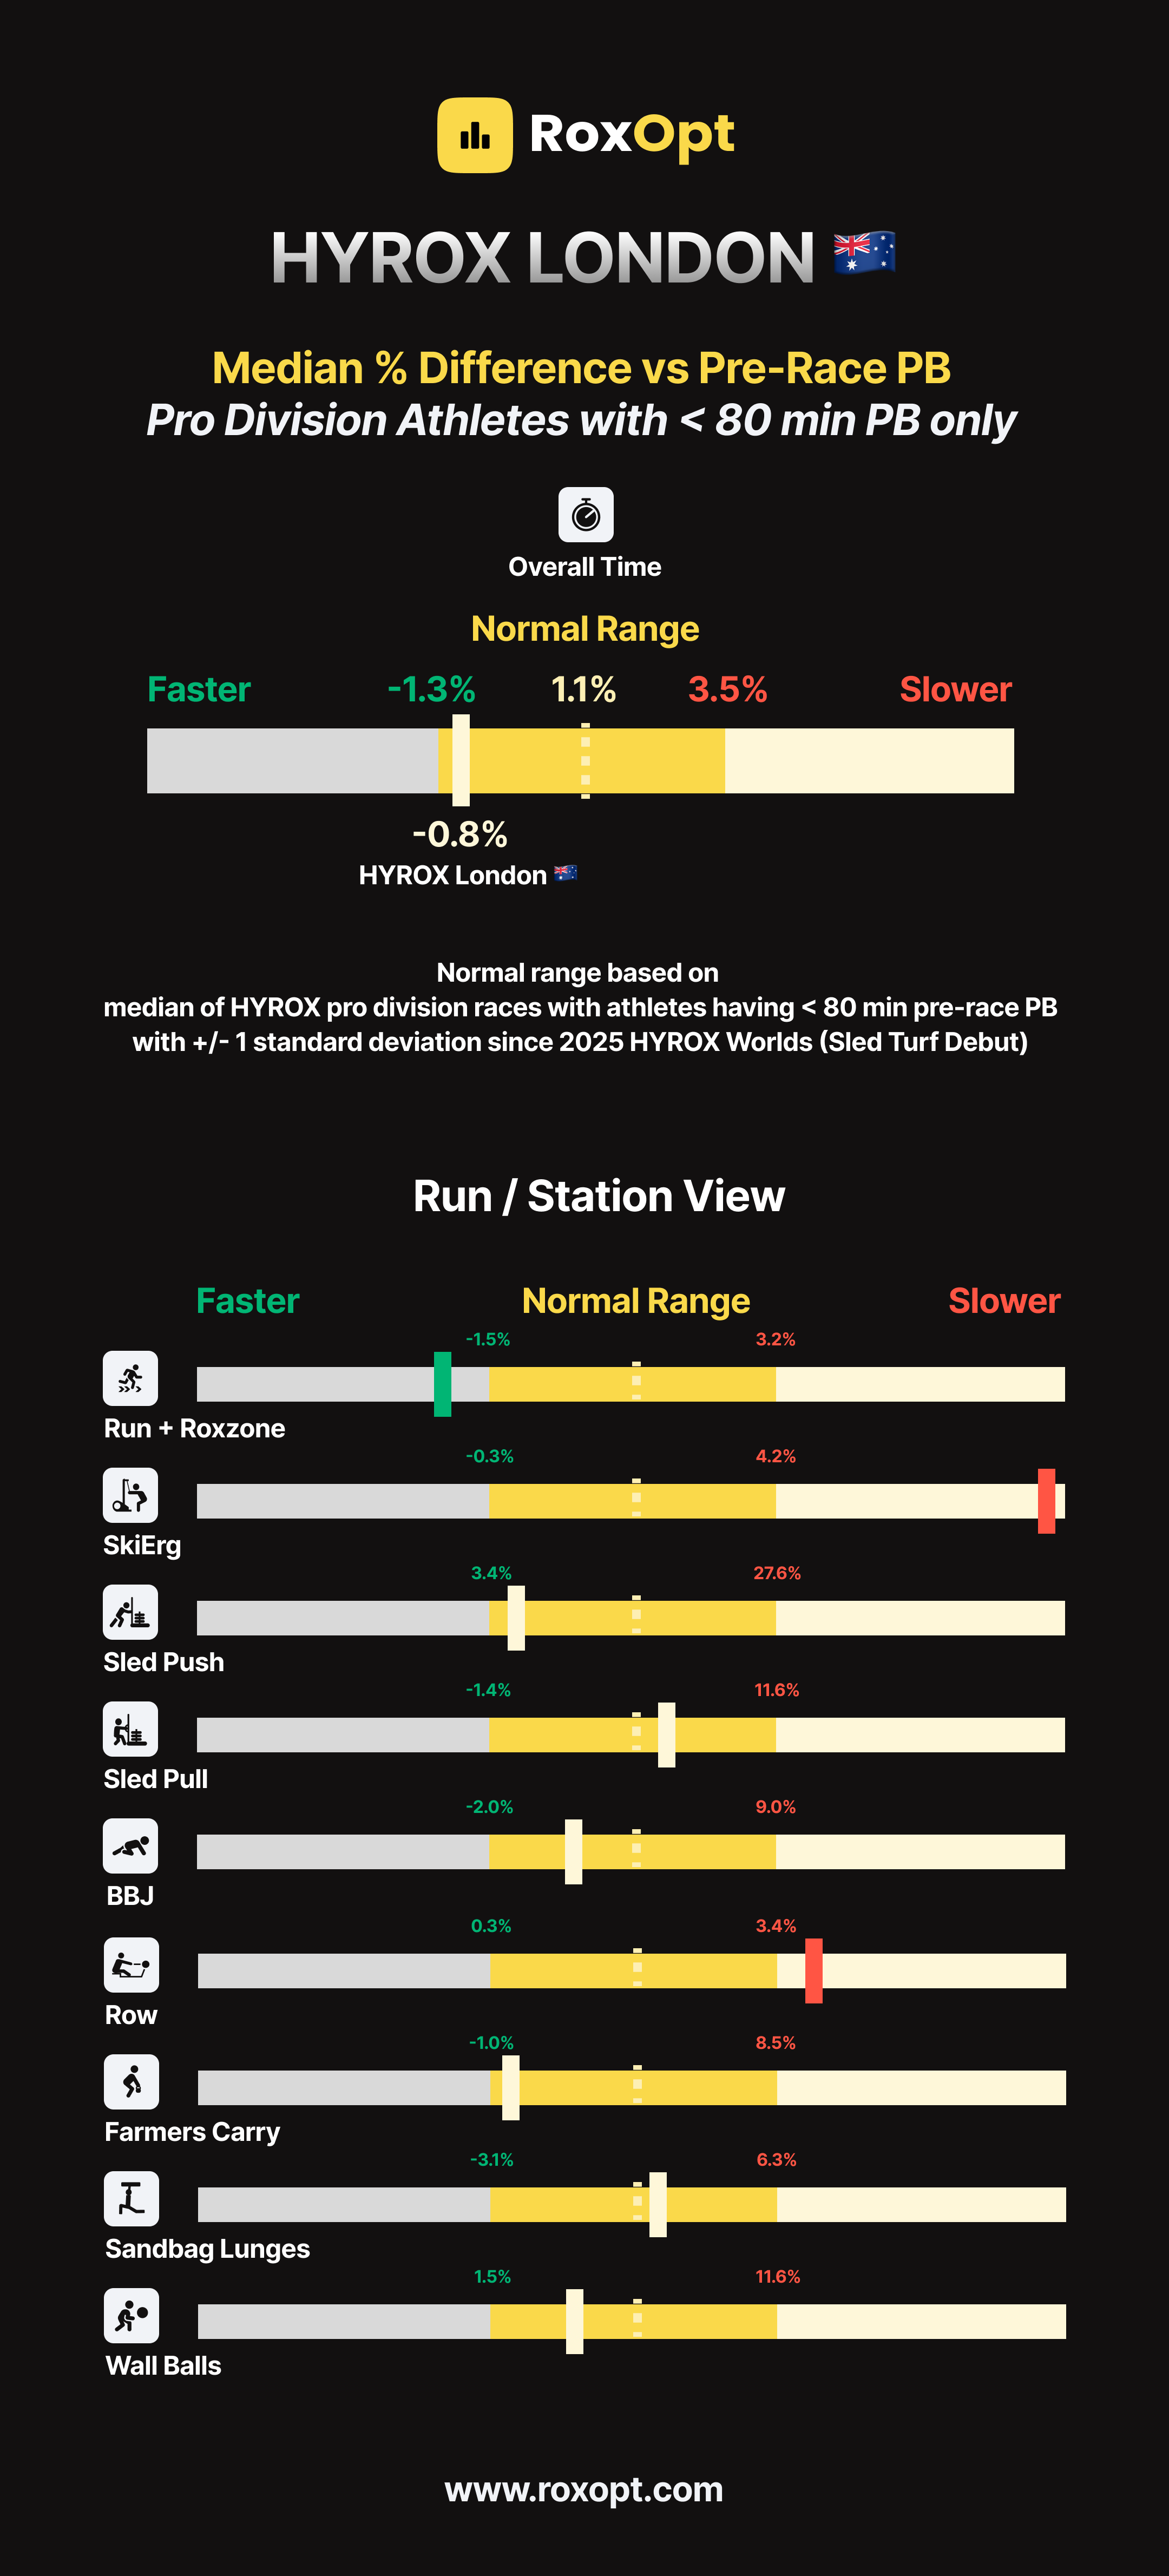
The common complaint of London being the fastest course all year was the perfect run conditions in London (1 lap) and the unusual run+roxzone PBs seen with top athletes.
And they were correct! The run conditions were unmatched.
From a run+roxzone perspective, London did indeed have the largest median % difference vs pre-race PB.
However, your HYROX time is more than your run+roxzone time.
Chicago was a normal run+roxzone course, but the station times had an even greater PBs than London’s run+roxzone.
Both courses were fast but for completely different reasons.
Who knows if there is a perfect metric to classify fast, normal, or slow courses but we think median % difference vs pre-race PB is the best we’ve come up with so far.
It captures volume and size of PBs and isn’t skewed by extreme values which is why we use the median and not the average.
We like % because it generalizes better across the population. A 5 min improvement is very different for a 58 min to 53 min jump (8.6%) vs 75 min to 70 min (6.6%).
We also limit to sub 80 min pro PB athletes to ensure a large enough sample size but also a population that likely trains consistently and doesn't experience volatile swings in performance which can create noisy data. Shoutout to Stephen Pelkofer (Data Scientist turned full-time HYROX athlete) for the suggestion.
This isn’t the perfect metric but we enjoy the challenge of trying to crack the code of classifying courses and bring a quantitative lens to a very qualitative debate.
Check out how Chicago vs London turned out.